Interim report 1 January – 31 March 2024
Positive profitability trend driven by Medtech
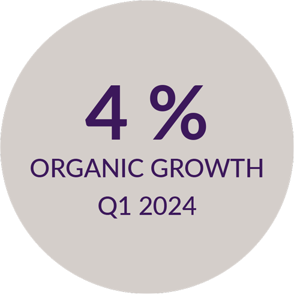
During the quarter, profitability strengthened in line with our priorities and organic sales increased by 4%. Labtech's sales performance was temporarily weaker, but the companies were largely able to defend their margins. Medtech delivered strong growth and it is gratifying to see a gradual improvement in profitability, driven in part by implemented improvement actions. |
||
|
|
1 JANUARY – 31 MARCH 2024 (3 MONTHS)
- Net sales increased by 5% to SEK 2,570 m (2,457). The organic growth, excluding exchange rate changes, was 4%.
- EBITA decreased by 20% to SEK 291 m (366), corresponding to an EBITA-margin of 11.3% (14.9). EBITA previous year included reversed contingent considerations of SEK 83 m. Adjusted for this EBITA increased by 3% and the EBITA margin previous year amounted to 11.5%.
- Profit for the period amounted to SEK 63 m (174).
- Earnings per share amounted to SEK 0.52 (1.43). Earnings per share for the last 12 months amounted to SEK 0.65 (3.54)
- Cash flow from operating activities amounted to SEK 97 m (105).
- The equity ratio was 39% (39).
- Return on working capital (P/WC) amounted to 46% (50).
| 3 months ending | 12 months ending | ||||
|---|---|---|---|---|---|
| SEKm | 31 Mar 24 | 31 Mar 23 | change | 31 Mar 24 | 31 Dec 23 |
| Net sales | 2,570 | 2,457 | 5% | 9,798 | 9,685 |
| EBITA | 291 | 366 | -20% | 1,060 | 1,135 |
| EBITA-margin | 11.3% | 14.9% | 10.8% | 11.7% | |
| Profit before tax | 100 | 206 | -51% | 233 | 339 |
| Profit for the period | 63 | 174 | -64% | 81 | 192 |
| Earnings per share before dilution, SEK | 0.52 | 1.43 | -64% | 0.65 | 1.56 |
| Earnings per share after dilution, SEK | 0.52 | 1.42 | -63% | 0.65 | 1.56 |
|
Dynamisk graf: Net sales (SEKm)
|
Dynamisk graf: EBITA (SEKm)
|
| 3 months ending | ||
|---|---|---|
| One-off costs, SEKm | 31 Mar 24 | 31 Mar 23 |
| Restructuring reserve Camanio Health | -6 | – |
| Reversed contingent consideration | – | 83 |
| Total one-off costs | -6 | 83 |
| 3 months ending | ||
| Classification in income statement, SEKm | 31 Mar 24 | 31 Mar 23 |
| Cost of sales | – | – |
| Selling expenses | -1 | – |
| Administrative expenses | -2 | – |
| Research and Development | -3 | – |
| Other operating income and expenses | – | 83 |
| Total one-off costs in the income statement | -6 | 83 |
Latest updated: 4/23/2024 3:10:41 PM by Eva Berger
