Interim report 1 January – 30 June 2023
Continued strong growth
"Increased commercial activity and new development initiatives
create growth and we see many opportunities to develop the business further."
Fredrik Dalborg, President and CEO
1 APRIL – 30 JUNE 2023 (3 MONTHS)
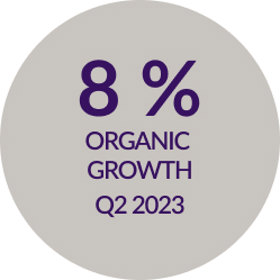
- Net sales increased by 14% to SEK 2,365 m (2,079). The COVID-19 related sales decreased to 0 m (36) and the organic growth excluding, COVID-19 related sales and exchange rate changes, was 8%.
- EBITA increased by 3% to SEK 247 m (240), corresponding to an EBITA-margin of 10.4% (11.6).
- Profit after tax amounted to SEK 33 m (76).
- Earnings per share amounted to SEK 0.27 (0.63).
- Cash flow from operating activities amounted to SEK 82 m (206). Capital tied up increased as a result of strong growth.
1 JANUARY – 30 JUNE 2023 (6 MONTHS)

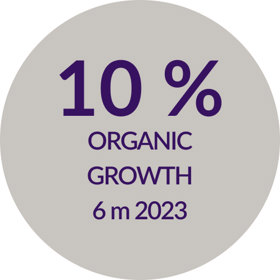
- Net sales increased by 4% to SEK 4,822 m (4,658), whereof the acquired growth amounted to 1%. The COVID-19 related sales decreased to 0 m (546) and the organic growth excluding, COVID-19 related sales, was 10%.
- EBITA decreased by 9% to SEK 613 m (675), corresponding to an EBITA-margin of 12.7% (14.5). EBITA includes a reversed contingent consideration amounting to 83 m, adjusted for this the EBITA-margin amounts to 11.0%.
- Profit after tax amounted to SEK 207 m (301).
- Earnings per share amounted to SEK 1.70 (2.47). Earnings per share for the last 12 months amounted to SEK 3.19 (5.07).
- Cash flow from operating activities amounted to SEK 187 m (538).
- The equity ratio was 38% (38).
- Return on working capital (P/WC) amounted to 53% (61).
| 3 months ending | 6 months ending | 12 months ending | ||||||
|---|---|---|---|---|---|---|---|---|
| SEKm | 30 Jun 23 | 30 Jun 22 | change | 30 Jun 23 | 30 Jun 22 | change | 30 Jun 23 | 31 Dec 22 |
| Net sales | 2,365 | 2,079 | 14% | 4,822 | 4,658 | 4% | 9,248 | 9,084 |
| EBIT | 136 | 138 | -1% | 394 | 476 | -17% | 726 | 808 |
| EBITA | 247 | 240 | 3% | 613 | 675 | -9% | 1,158 | 1,221 |
| EBITA-margin, % | 10.4% | 11.6% | 12.7% | 14.5% | 12.5% | 13.4% | ||
| Profit before tax | 70 | 94 | -26% | 276 | 383 | -28% | 495 | 602 |
| Profit for the period | 33 | 76 | -56% | 207 | 301 | -32% | 389 | 483 |
| Earnings per share before dilution, SEK | 0.27 | 0.63 | -57% | 1.70 | 2.47 | -31% | 3.19 | 3.96 |
| Earnings per share after dilution, SEK | 0.27 | 0.62 | -56% | 1.70 | 2.46 | -31% | 3.18 | 3.95 |
|
Dynamisk graf: Net sales (SEKm)
|
Dynamisk graf: EBITA (SEKm)
|
Latest updated: 7/13/2023 6:39:44 PM by Lina Astrom
