INTERIM REPORT
JANUARY 1 – SEPTEMBER 30, 2025
Good organic growth and strong earnings performance
|
AddLife’s companies performed strongly during the quarter. Organic growth was solid, margin improvement continued, earnings increased significantly, and the debt ratio was reduced, in line with our priorities and ambitions. |
THIRD QUARTER
JANUARY – SEPTEMBER, 2025
|
 |
| Q3 | Q3 | ∆ | Jan-Sep | Jan-Sep | ∆ | Oct 2024- | Full year | |
| SEKm | 2025 | 2024 | % | 2025 | 2024 | % | Sep 2025 | 2024 |
| Net sales | 2,429 | 2,344 | 4 | 7,709 | 7,468 | 3 | 10,527 | 10,286 |
| EBITA | 270 | 223 | 21 | 920 | 813 | 13 | 1,266 | 1,159 |
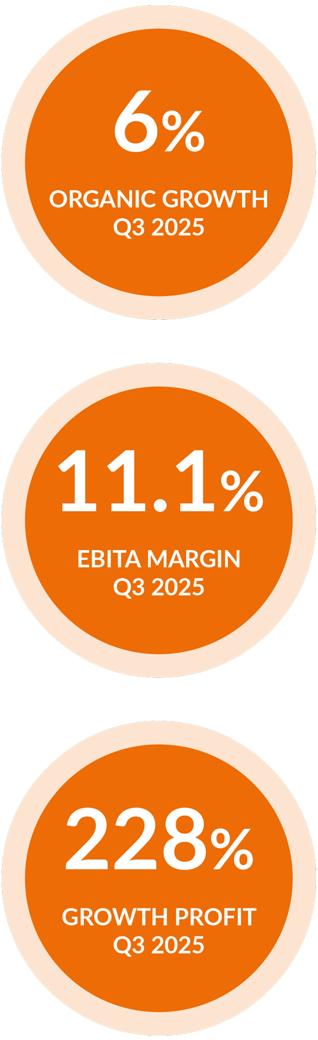
| EBITA margin, % | 11.1 | 9.5 | 11.9 | 10.9 | 12.0 | 11.3 | ||
| Adjusted EBITA | 270 | 230 | 17 | 920 | 819 | 12 | 1,266 | 1,165 |
| Adjusted EBITA margin, % | 11.1 | 9.8 | 11.9 | 11.0 | 12.0 | 11.3 | ||
| Profit/loss before taxes | 111 | 42 | 164 | 429 | 255 | 68 | 579 | 405 |
| Profit for the period | 82 | 25 | 228 | 302 | 160 | 89 | 396 | 254 |
| Earnings per share (EPS), before/after dilution, SEK | 0.66 | 0.19 | 247 | 2.47 | 1.30 | 90 | 3.23 | 2.06 |
| Cash flow from operating activities | 145 | 137 | 6 | 504 | 429 | 17 | 1,170 | 1,095 |
|
Dynamisk graf: Net sales (SEKm)
|
Dynamisk graf: EBITA (SEKm)
|
Latest updated: 10/22/2025 5:03:11 PM by Lina Astrom